Including free burndown chart excel template for download
Agile teams don’t work with traditional deadlines. However, one thing is not to plan all work steps in advance but planning is still key. It’s important to be able to estimate the progress of the project, for example how much work still needs to be done in the current sprint? Is your team on schedule or working too slowly? Which resources are still needed for which task and for how long? These are all frequently asked questions in agile projects. In the agile world, the burndown chart has established itself as a tool for answering these questions.
Experienced project teams, as well as teams working on many tasks at the same time, usually use Scrum software. This, however, is not compulsory for smaller teams that are new to the world of agile project management to invest in a more comprehensive software solution immediately.
The burndown chart provides such teams with everything they need to develop a feel for the agile work environment before they make that decision. We have created an Excel template for this purpose to allow your company (or a team) to use some of its features without having to make a commitment to a permanent transition.
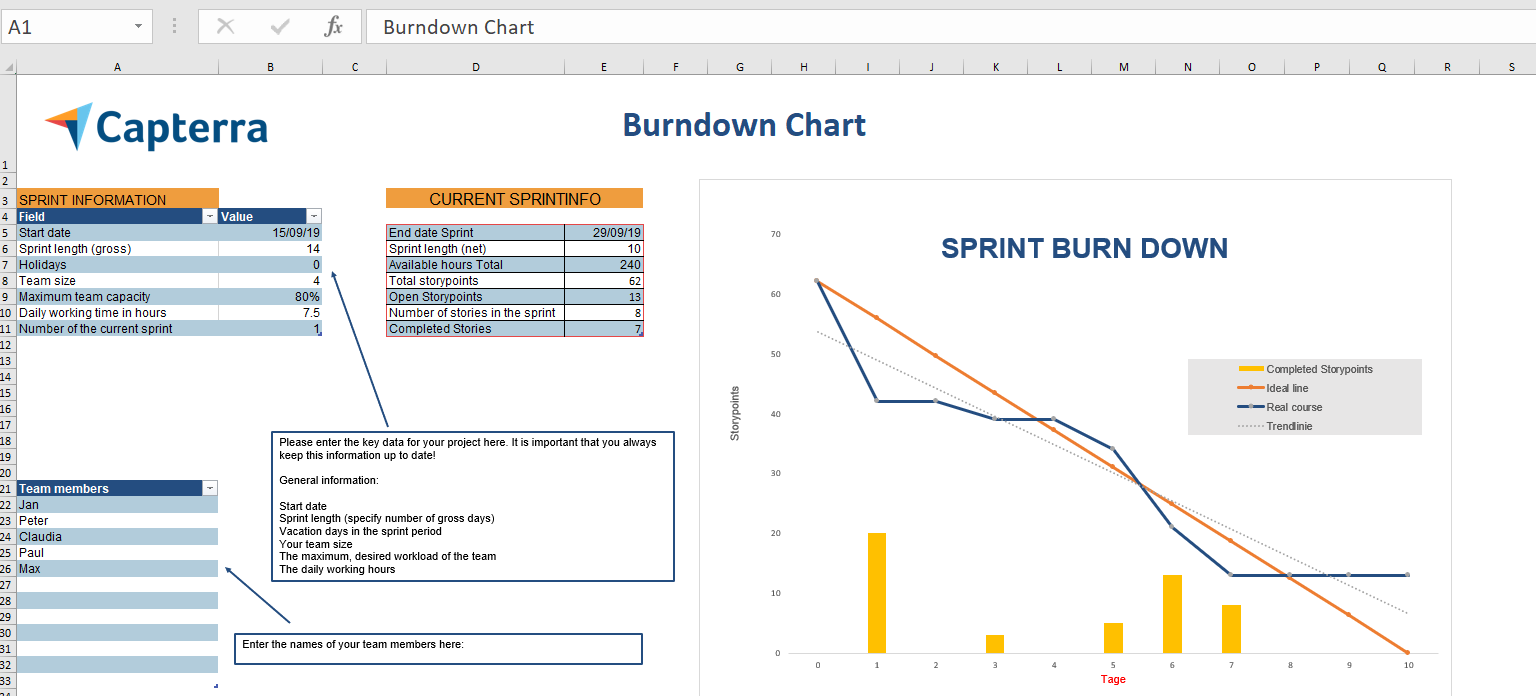
The template contains information on how to fill out the individual fields. In addition, all formulas are already included to create the chart and you only need to add in the data.
In this article, we will introduce:
- The most important features of any agile project
- The most common agile method: Scrum
- The advantages of the most used Scrum tool: the burndown chart
The king of agile project management: Scrum
Scrum and Kanban are agile methods that are very popular at present. The goal of agile project management is to define a framework in which teams can work as effectively as possible. Agile methods are characterised by flexibility and transparency. Therefore is not a question of developing an exact plan in advance – in agile projects, the project goal is often only visible in the outline at the beginning. Instead, it’s important to work in recurrent cycles to get closer to a final result that fulfils the customer’s wishes (which may only be worked out during the course of the project). This also shows why overview and transparency are so important. If it’s not 100% clear where to go, at least is important to know where you stand and what the next steps will look like. Kanban creates the necessary overview with the help of the so-called Kanban Board, which visualises the workflow of the project. In Scrum projects, short feedback loops in daily stand-up meetings serve the same purpose. In addition, Scrum relies on the burndown chart for visualisation.
Scrum at glance
Application
Scrum is a method for agile work that was developed in software development. It’s particularly suitable for the development of complex solutions and products and is therefore mainly used in the areas of IT and engineering. Scrum relies on a continuous and experience-based approach to improvement, with the goal of shortening lead times and minimising waste.
Work packages
In order to achieve these goals, Scrum relies on the pull principle when processing the work to be done. The team therefore determines which and how many work packages it will carry out in the near future. For this purpose, the team independently actions tasks from a pool of unfinished tasks. The team then estimates the relative effort per work package, taking into account the complexity and risk involved. This effort is added up for a sprint duration and thus results in a team-dependent speed. Once a team has levelled off, i.e. reliably estimates and delivers similar average speeds per sprint, this measure is used as a benchmark for subsequent sprints.
Sprints
Scrum uses so-called WIP (Work in progress) limits. This means that only a certain number of work orders can be executed per work segment. The number of work packages in Scrum projects is limited by the duration of a sprint, usually between 1 and 4 weeks.
Roles
In each Scrum project the three roles: Product Owner, Scrum Master and Development Team are assigned with specific tasks and responsibilities.
Tools
Scrum teams can either use Excel templates, agile project management software or special Scrum software. Which tool is best suited for your company depends on the scope of the tasks.
In large Scrum projects, tasks must be broken down into a large number of story points so that the effort can realistically be estimated. This leads to a high amount of requirements that are best managed in a more modern version of software.
In smaller Scrum projects or as an introduction to the agile world of work, IT teams can use the Excel template from Capterra.
It’s also important for the application of the Excel template to be familiar with the idea of story points and to know what a burndown chart should actually achieve. Therefore, we will go into these concepts in more detail.
The burndown chart – visualisation made easy
One of the most important tools in Scrum projects is the burndown chart. It visualises how much work still needs to be done at the current time.
For this purpose, the agile team indicates at the start of a sprint which tasks it wants to complete in this sprint. It also estimates which of these tasks are worth how many story points. Depending on the complexity of the task, the story points are estimated. The estimation starts with 1 for “very easy” and continues with 2 for “easy”, 3 for “more difficult”, 5 for “even more difficult”, etc.
The sudden increase in the sequence of numbers is intended to ensure that the increasing uncertainty is adequately taken into account as complexity increases.
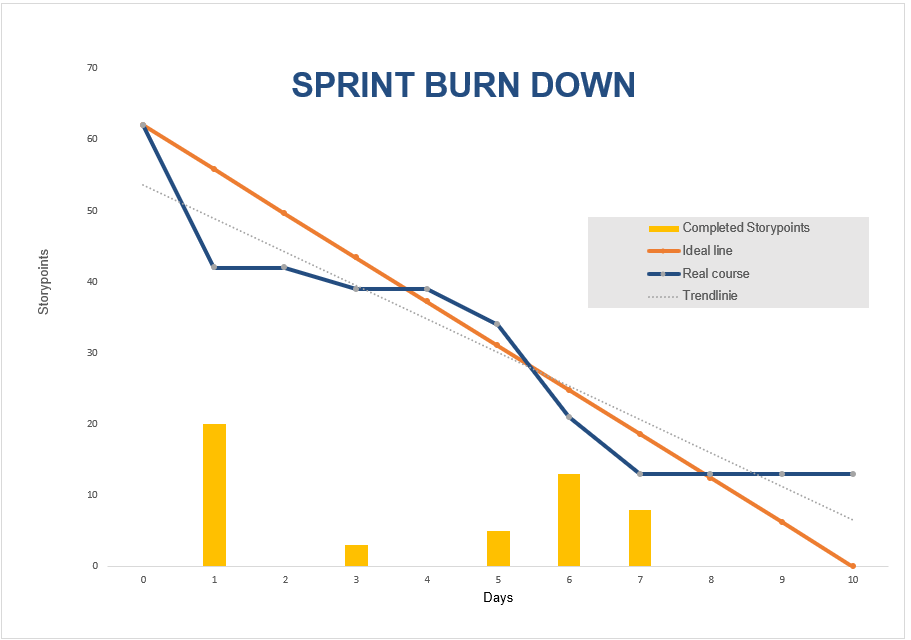
The sum of all story points is then entered in the burndown chart for day 0 (X-axis = days, Y-axis = remaining story points). At the end of each day, the system checks which stories (tasks) have been completed. The remaining story points are entered in the chart for the corresponding day.
If you connect all entered points, you get a curve that shows the real course of the project (dark blue in the chart below). If you connect the story points on day 0 with the X-axis for the last day of the sprint, you get the so-called ideal line (yellow in the chart below). If the real course is below the ideal line, the project team completes tasks faster than estimated. If the real course rises above the ideal line, the team is delayed.

Once you have understood how the burndown chart works, it’s very easy to create, maintain and understand. This makes it a simple but very important tool for agile project management, allowing the Product Owner, Scrum Master and the Development Team to keep track of whether project requirements and deadlines can be met.
The burndown chart also serves as a risk management and early warning system. Problems, bottlenecks and deviations from estimated story points and actual implementation are quickly identified thanks to it.
The information from the chart can also be used for communication with customers. Especially customers who are not yet used to the agile implementation of projects sometimes find it difficult not to receive firm commitments for fixed deadlines. It’s easy to get the impression that the project is somehow being worked towards without anything specific getting around.
The burndown chart can be a great tool for visualising project progress and making it tangible. The ability to show progress at any time shows the customer that the team is working professionally and reliably.
Why not try it out?
Switching to agile working is not a small thing. Our recommendation is that smaller teams that wish to try the burndown chart simply download our template and experiment with it. The best thing for you and your team is to choose a project that is not too new and relatively easy to do. So you can concentrate on what difference the agile method makes to the project, and you always know that you can fall back on old routines to complete the project successfully.
Here is the link to download the Capterra template for free.


